These graphs take a certain amount of manual data manipulation to generate times of day from the times of the tide predictions. I will be making more of them. In his book Sea Level Science, David Pugh discusses various varieties and aspects of tides. Especially, Albert Defant's Physical Oceanography, Volume II gives detailed discussions. One of these, or perhaps others, certainly will have information about the astronomical and oceanographic factors behind the differences in these profiles.
Looking at these, I know there is more to learn about this. I'm willing to have posters printed, if anyone is interested. One possibility would be a large poster with several such graphs. I've tried to use colorblind-friendly colors, but this is a work in progress. For one thing, gri does not have the same color palette support as R. And for another, there are a number of varieties of color blindness, each of them just as different from the next, as from my own "Normal" color vision. What would these look like to a stomatopod (with 10 cone types, I think)?
San Francisco
 Kawaihae, Hawaii Island


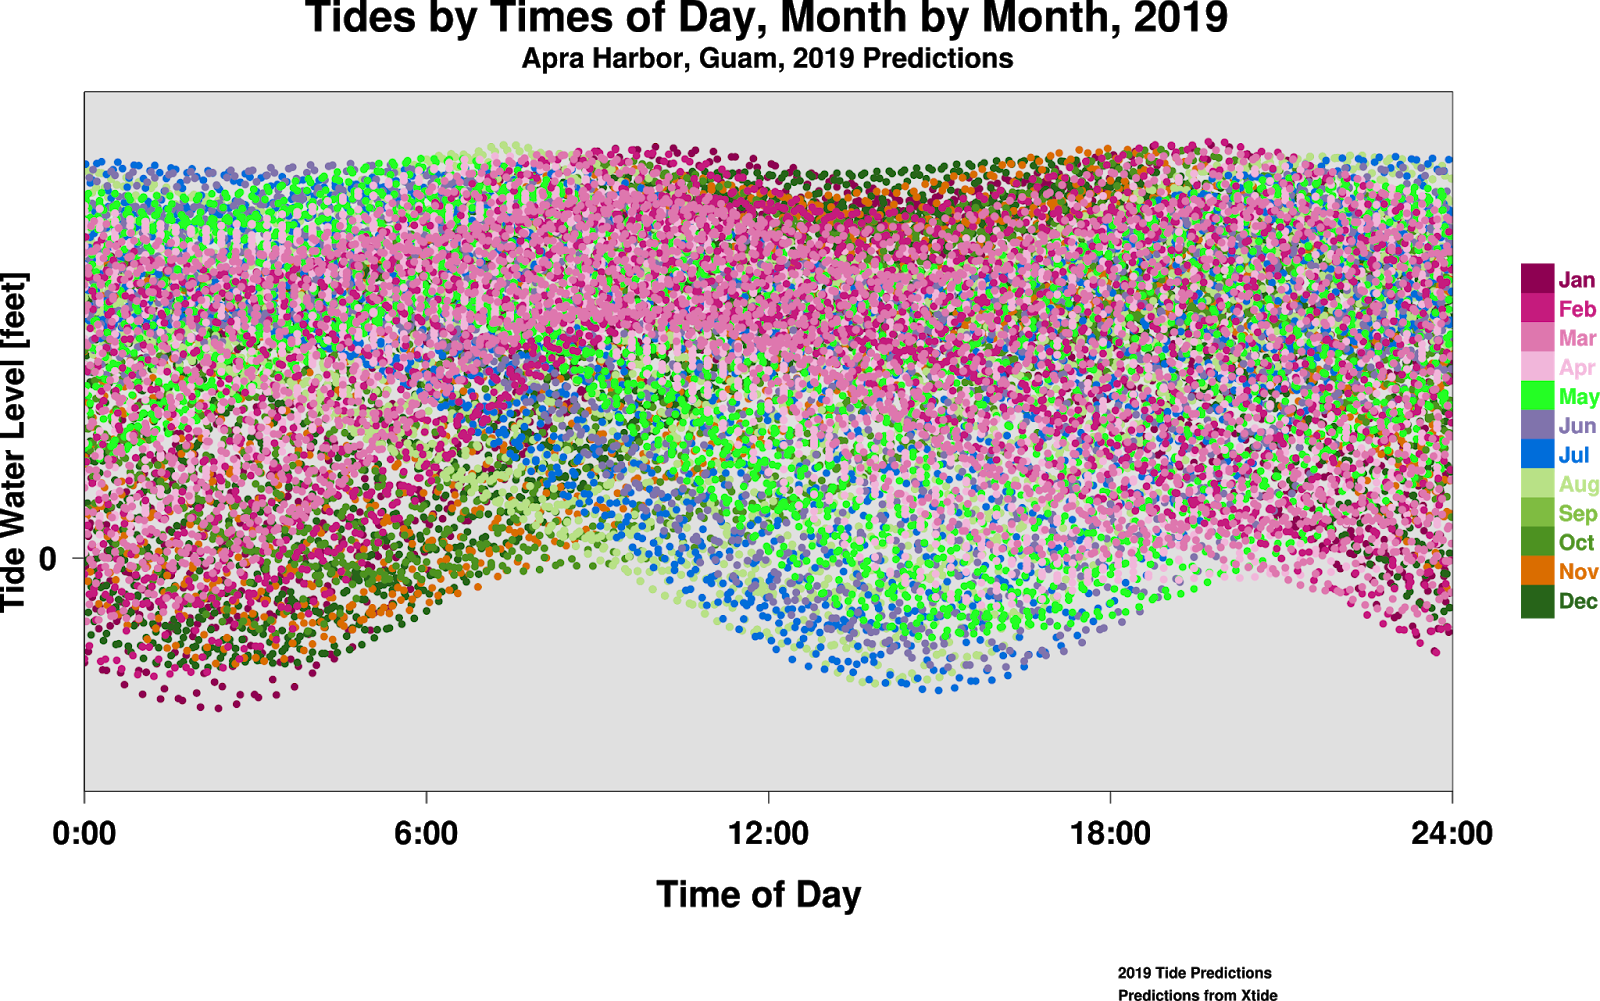
Apra Harbor, Guam


No comments:
Post a Comment