Wednesday, March 25, 2020

Tuesday, March 24, 2020
An experimental color palette using the Polychrome R package.
A second try, with a custom palette which I generated using Polychrome, an R package.
It may be necessary to scroll a long ways down the page to the previous post, another similar example.
Move the slider vertically. This is an example of strong Deuteranopia, simulated through Inkscape's Color Blindness filter. If this works, a howto will come later. The idea was to generate a series of colors that maximally discriminable for three kinds of color blindness. Did it work? It's pretty hard to read.
\Hope it works!!!
My first colorblind experiment. From another blog of mine.
This was my first try to produce a colorblind friendly graph of height of tide (on the y, vertical, axis) as a function of clock time (on the x axis).
I used the "Juxtapose" web tool to compare a graph (work in progress) with a simulation in The Gimp of what this image would or might look like to a person who is somewhat colorblind with Deuteranomaly (apparently weak green vision). For this simulation I have used the Color Vision Deficiency python plugin for the Gimp.
We can be pretty sure that these figures do not look like this to colorblind people; but I can see that my intense, contrasting color palette does not work to discriminate the different lines for persons with color deficient vision.
The color deficit is Deuteranomaly weak green. Pull the slider to the right to see the original image; slide to the left to see the simulation of what we may think a person with this deficit in color vision might see.
Scroll further down to see another type of colorblindness.
The objective will be to produce colorblind-friendly graphs. I found this on the blog of the website with the slider maker: https://knightlab.northwestern.edu/2016/07/18/three-tools-to-help-you-make-colorblind-friendly-graphics/index.html
- http://colorbrewer2.org
- Chroma
- Checking: other ways to visualize/simulate your work
[Depends on Java 6, not officially supported by Arch]
- Sim-Daltonism(iOS or MacOS only)
Friday, February 7, 2020
King Tides of February 2020 in San Francisco Bay
King Tide is an imprecise term, meaning tides that are relatively higher than most high tides during a year. In 2020, on the Pacific Coast of North America, the highest astronomical tides of the year are predicted in December. However highest tides of January, February and November are also quite high, and have been called King Tides. As this is written, we expect King Tides on February 8th and 9th. The following is a graph of tides every 20 minutes for 2020, at Pier 17, next to the Exploratorium, in San Francisco.


Predictions for the Fortnight from 2 through 15 February 2020. The highest tides, on February 8 and 9, are commonly referred to as King Tides.

Thursday, August 15, 2019
More Probability Distributions of Tides
What does a probability distribution tell us? It can give us an idea how many hours per day an organism in a particular zone will be exposed to the air. It would be more interesting to know the tides of exposure to sunlight. For corals this is essential. David Pugh says that the S2 harmonic constituent can give us an idea without graphs. This is a subject for a future project.
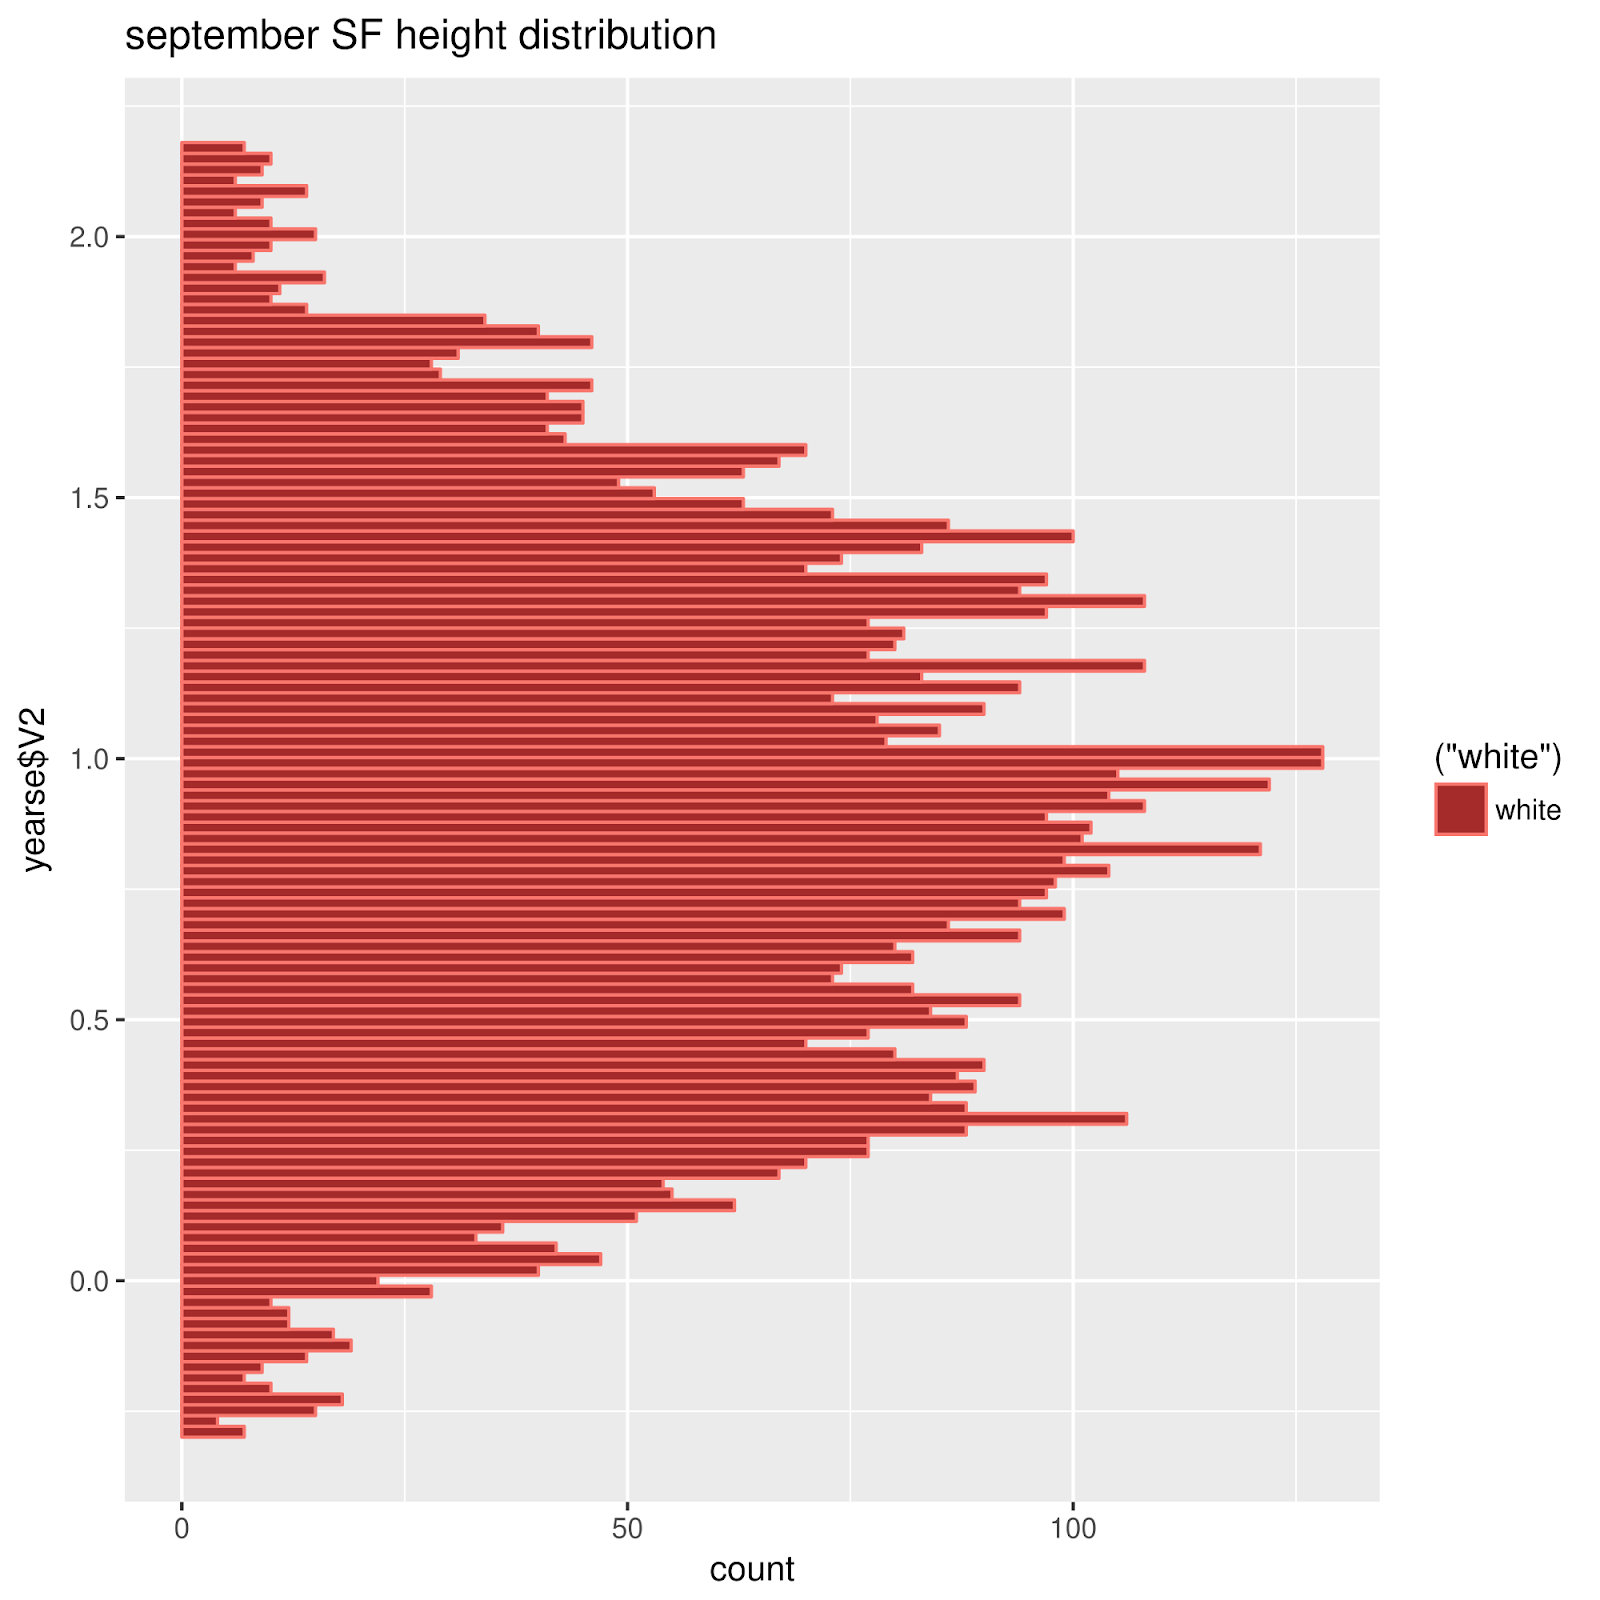
For how, the following is an effort from several months back, breaking down the probability distributions of heights month by month, for San Francisco's venerable tide gauge (thought these may be predictions). I wonder what this has to say in comparison with St. Petersburg, Florida's beeswarm plot. Obviously, it's impossible to compare them well using these two distinctly different methods. The top row shows frequency distributions for January, February, and March, and so on in the other rows; all graphs are from predictions.

One thing I noticed was a similarity of the distributions for June and December, around times of Solstices. The same may be said for the months of the Equinoxes, March and September. I now want to see another graph, the specific one-day distributions for the exact days of Solstices and Equinoxes. Other parameters, like apogee and perigee, perihelion and aphelion, lunar declination have important effects.
Comparing Two Sites (Full year of predictions for each)
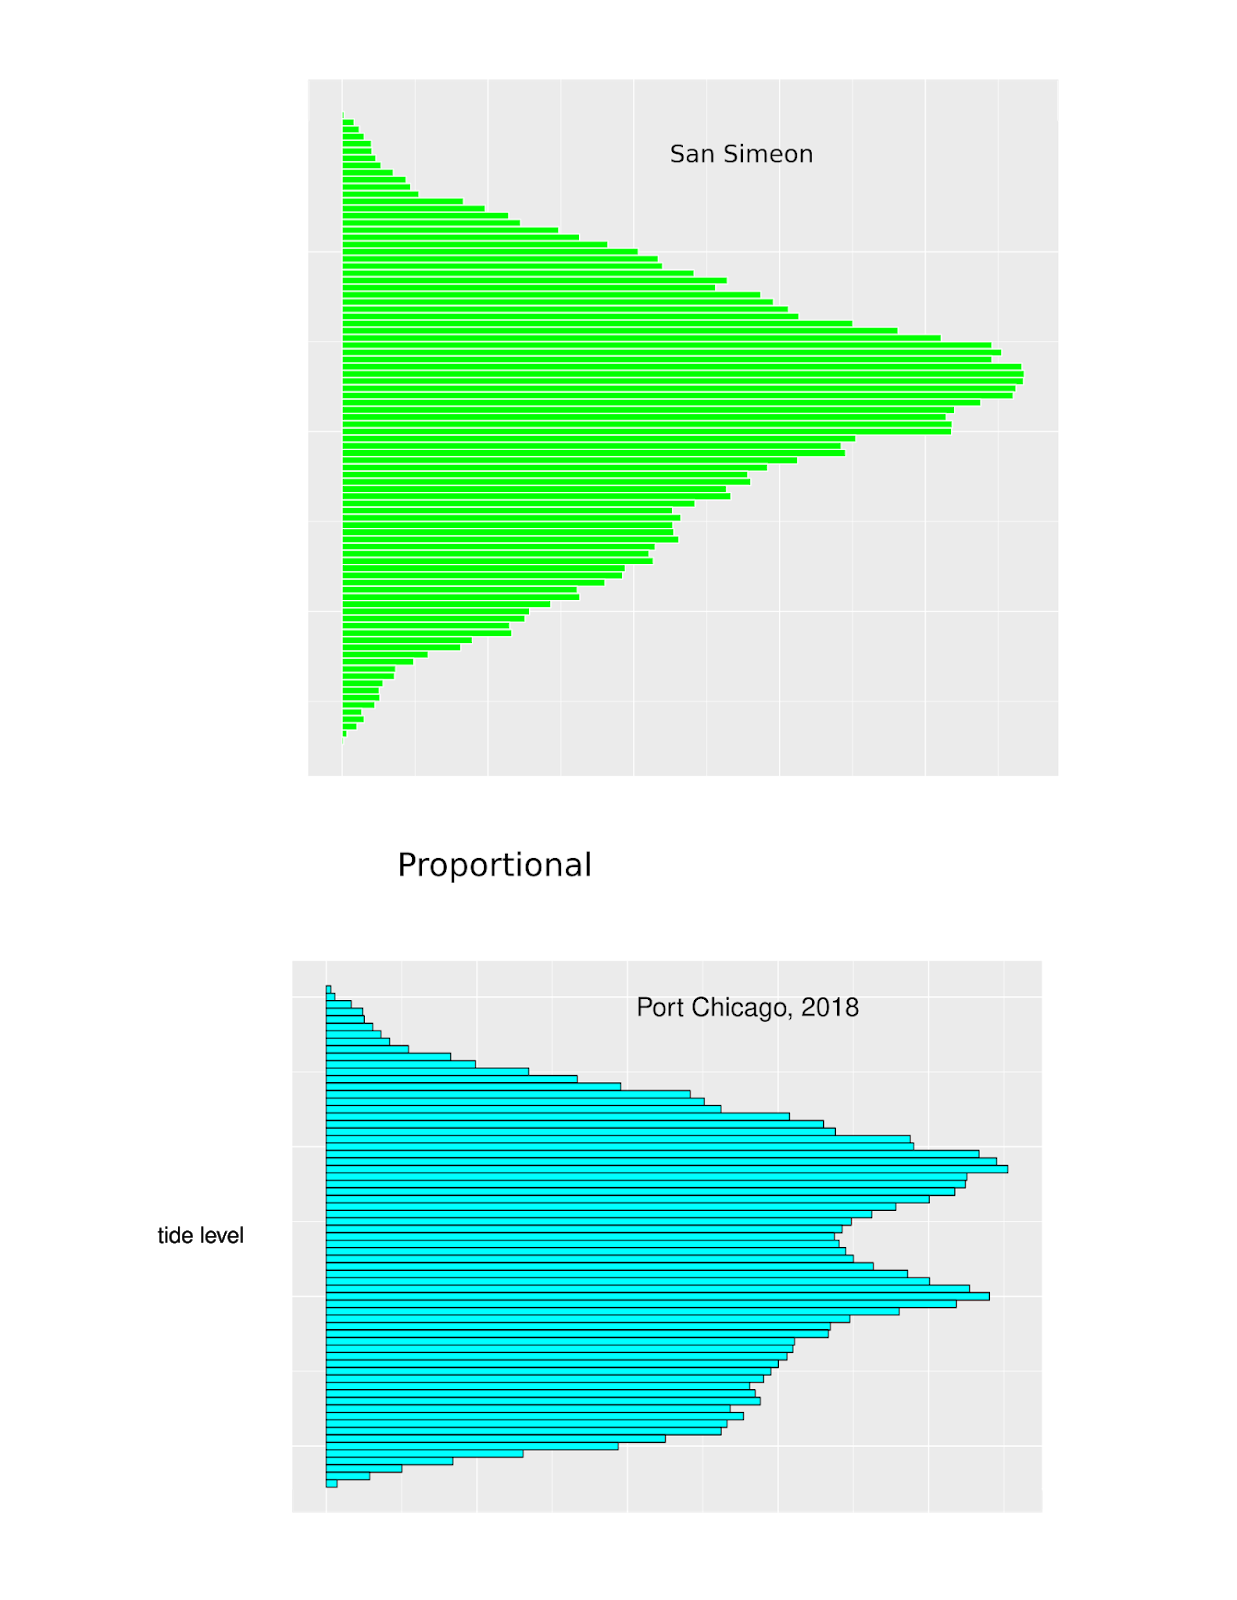
Port Chicago some 30 miles up the Northern Reach of San Francisco Bay, in Suisun Bay.
Months of Solstices and Equinoxes,
Chuuk Lagoon
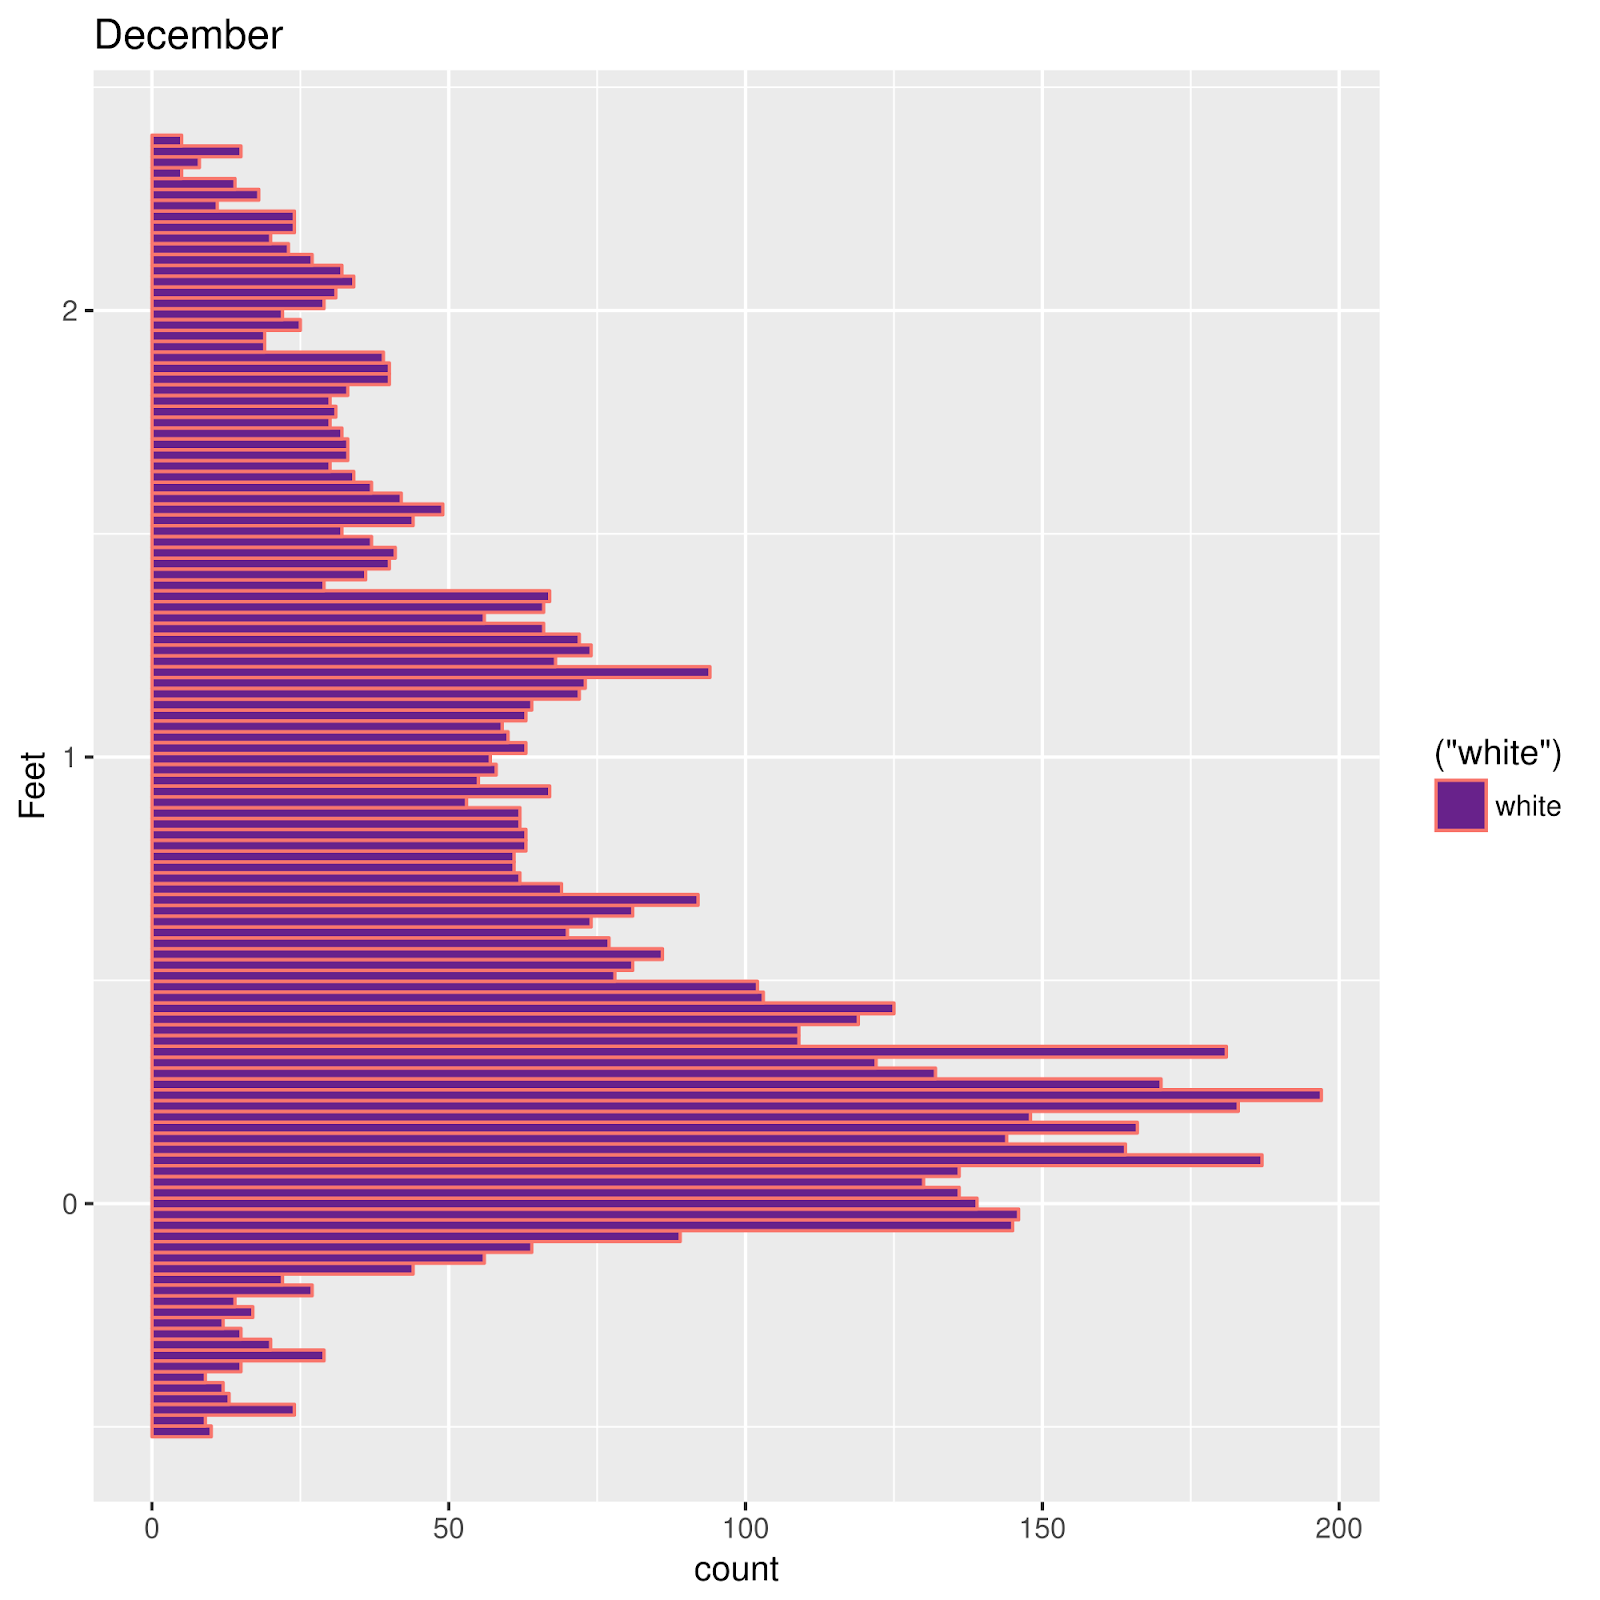 |
| December |
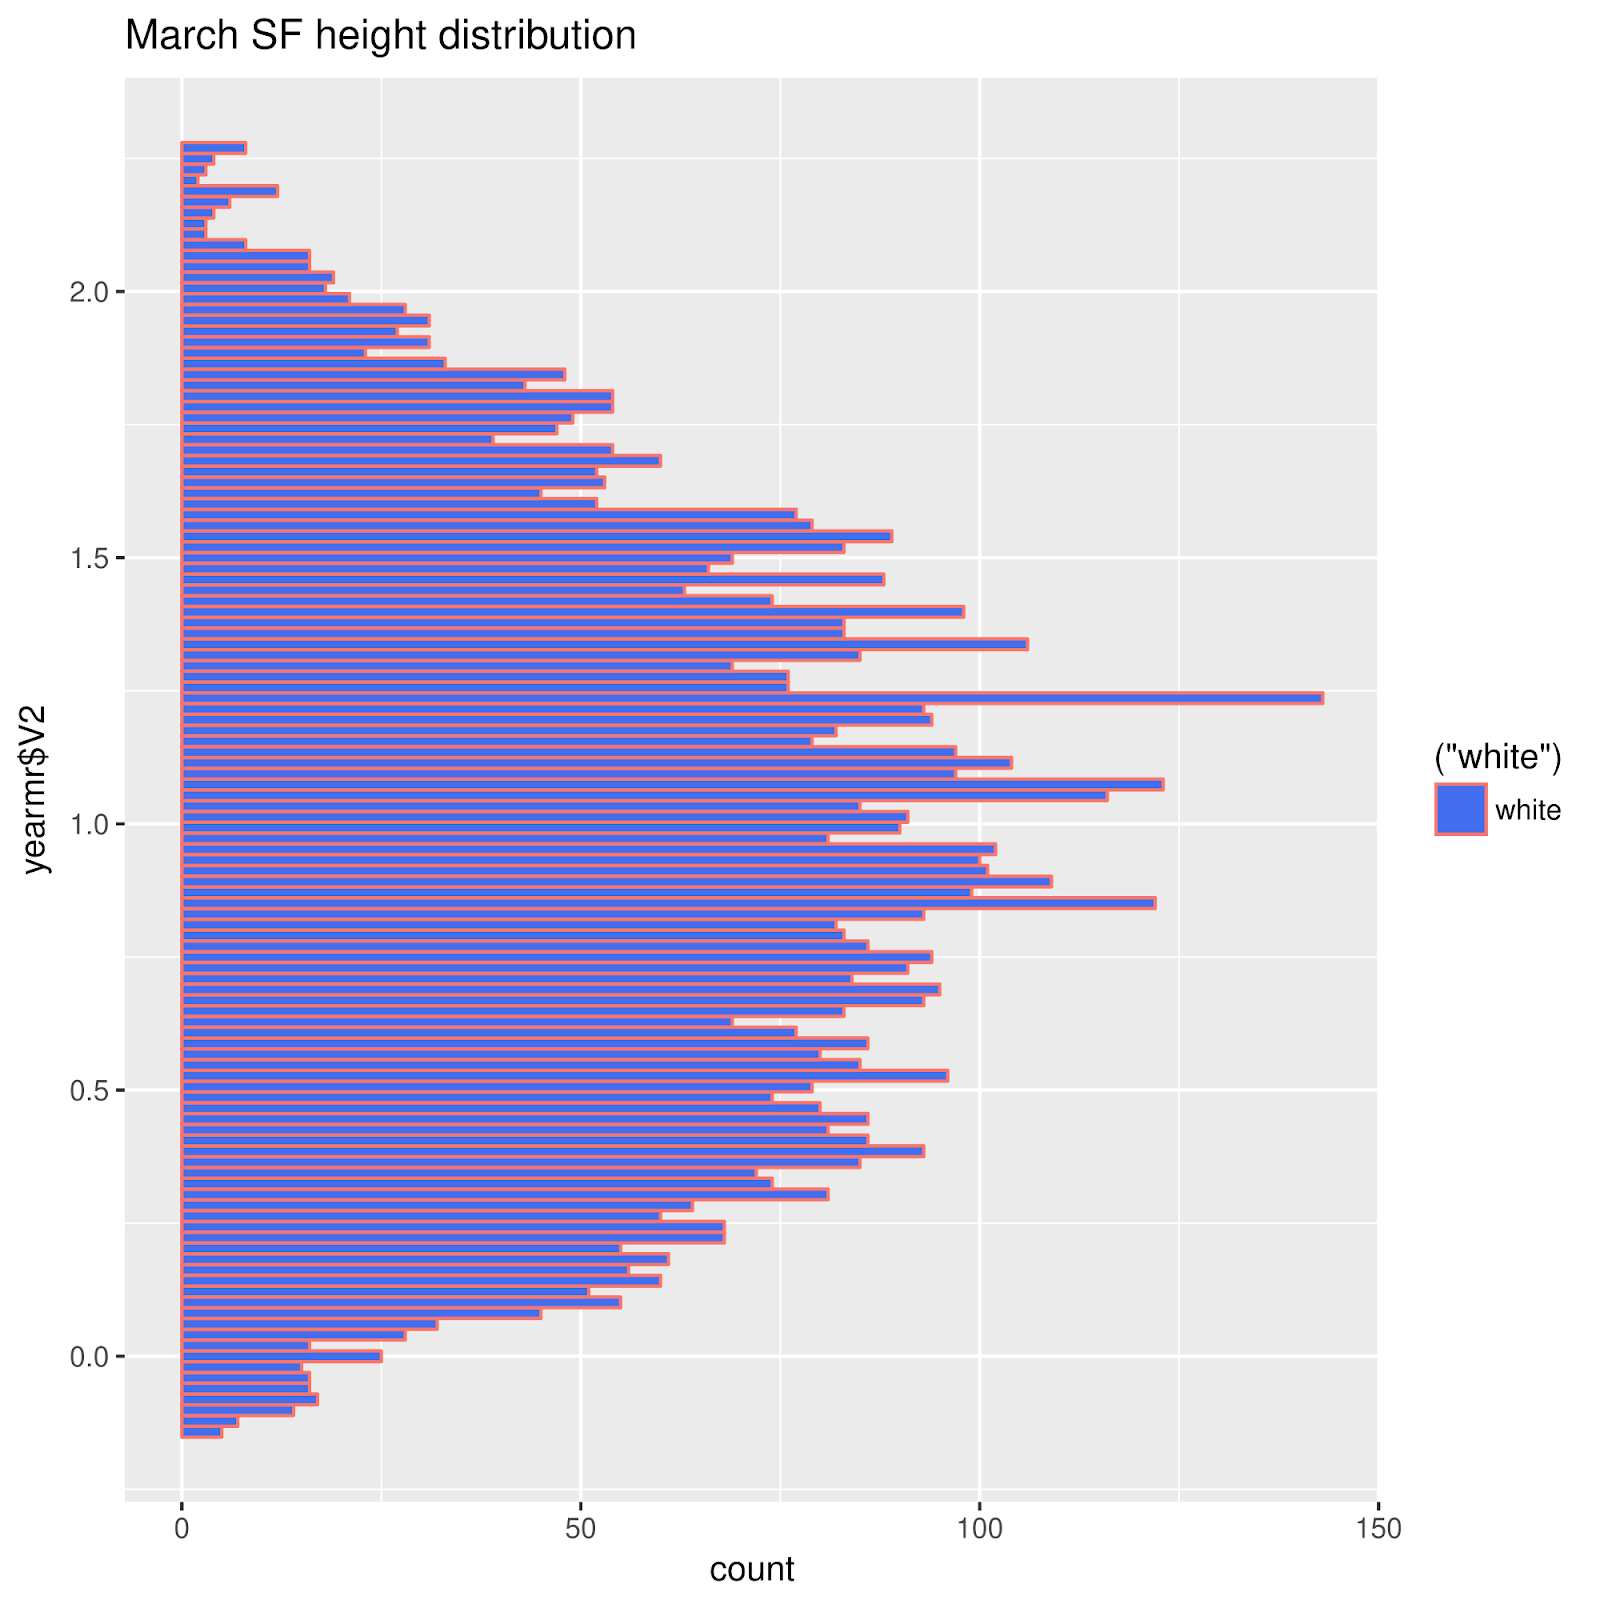 |
| March |
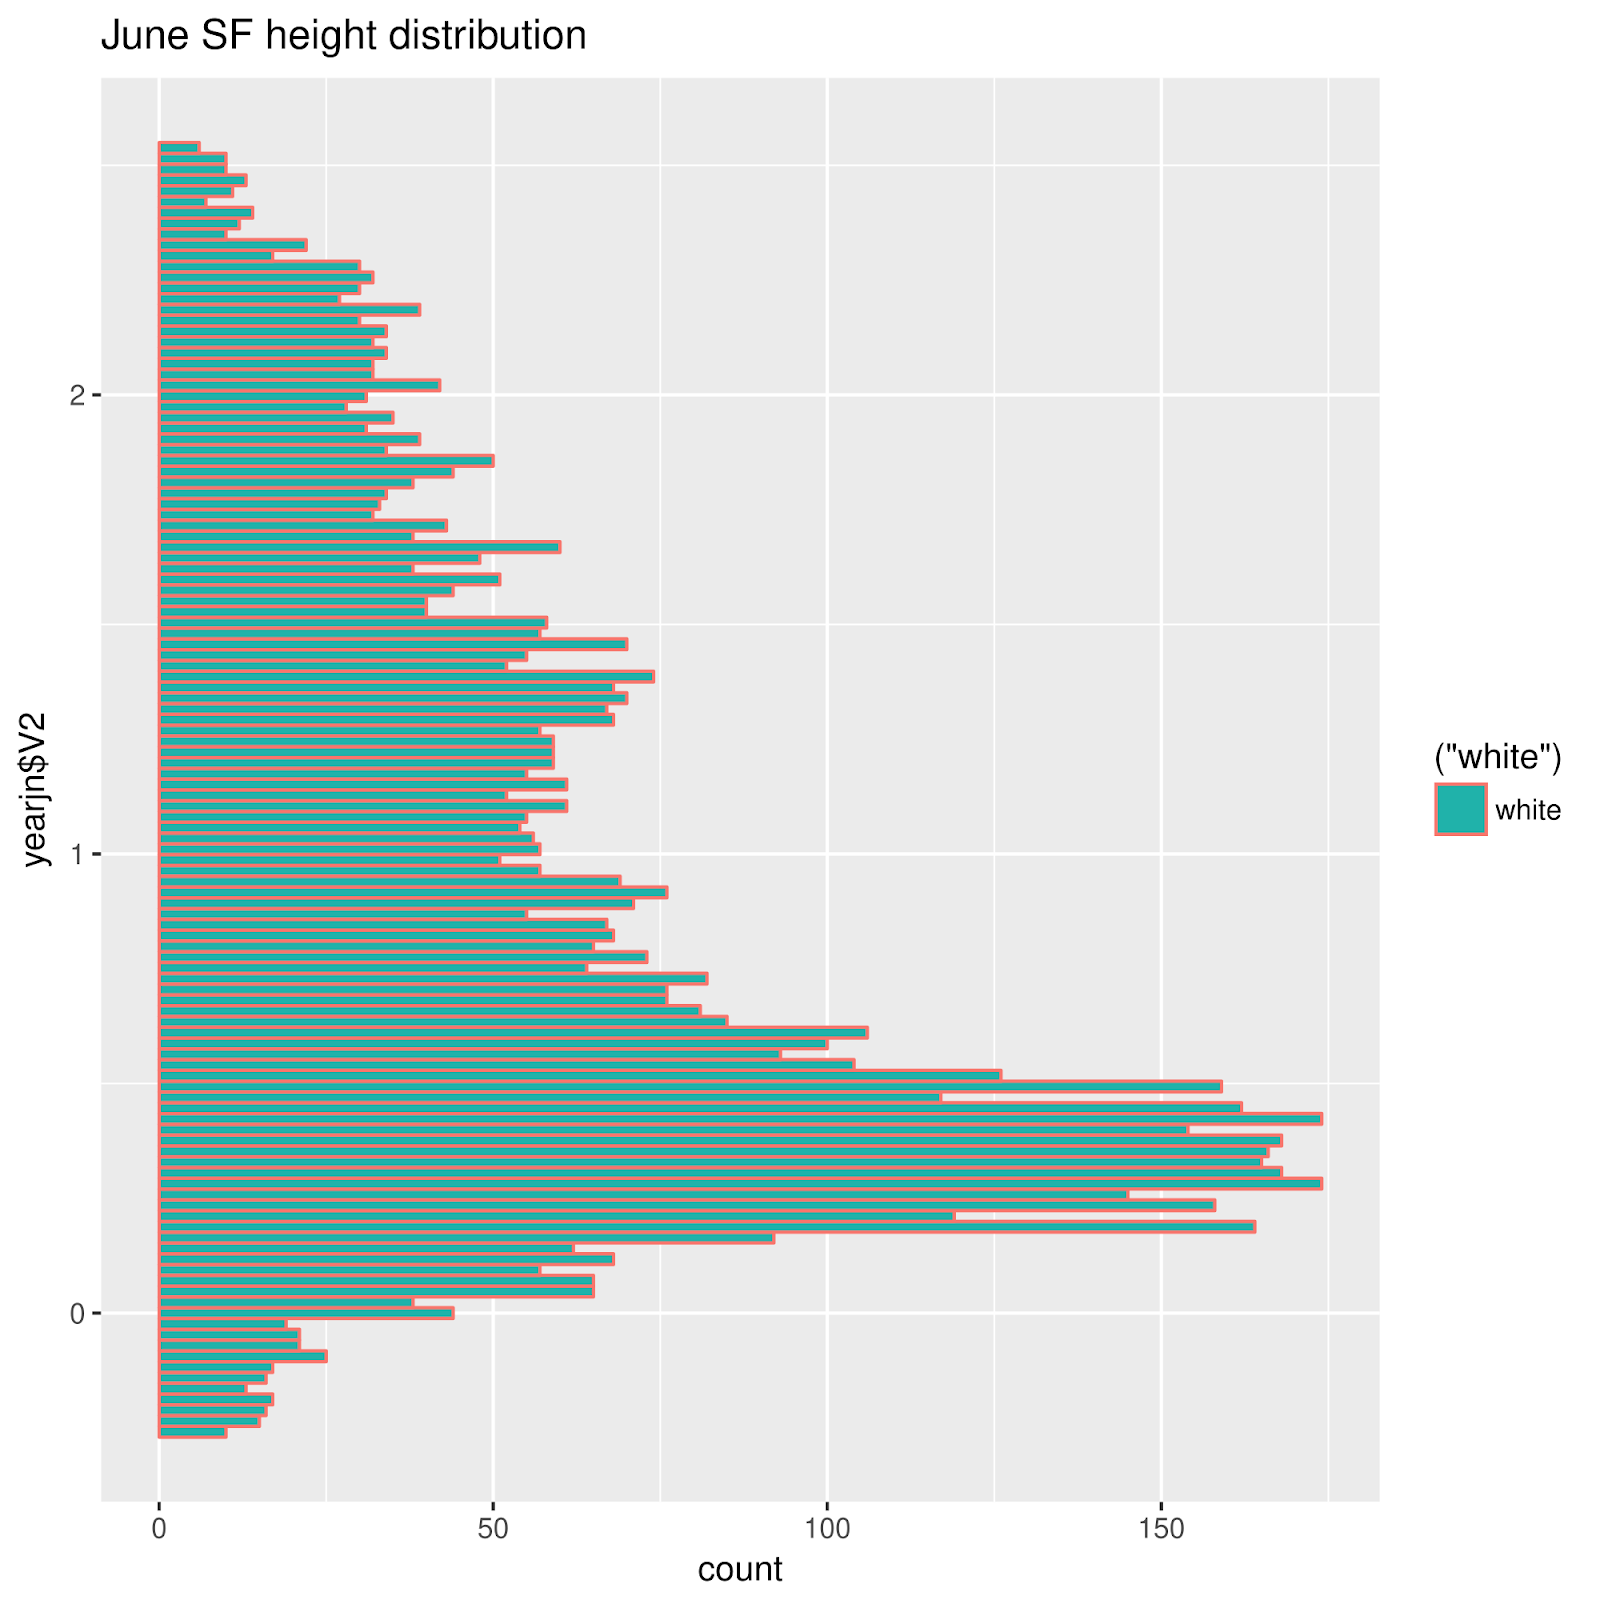 |
| June |
 |
| September |
Equinoxes are in March and September. Solstices are in December and September. Why do the Equinoxes resember one another? Why do the Solstices resemble one another? ???
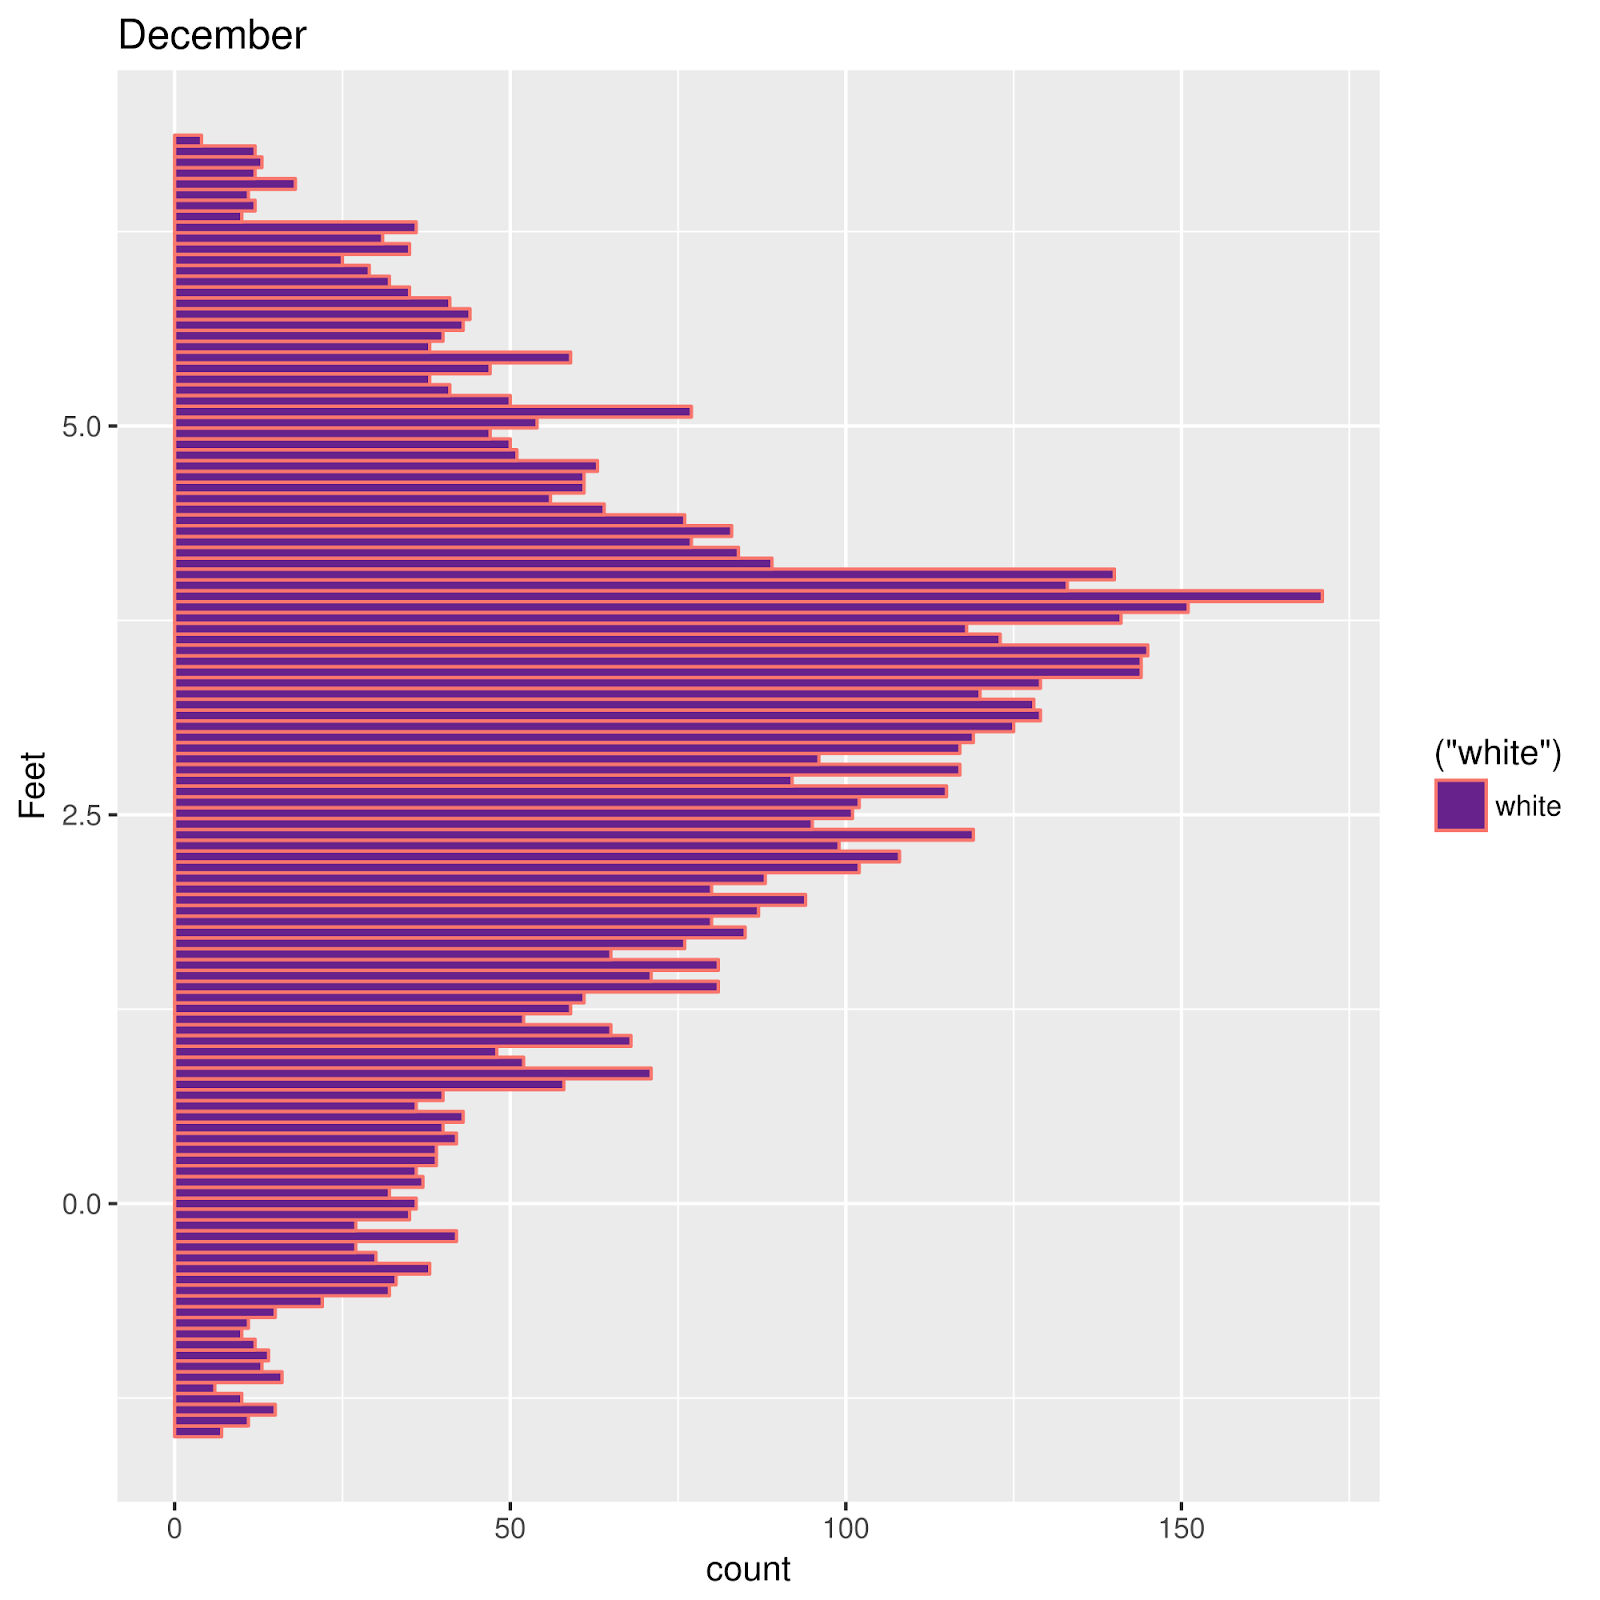
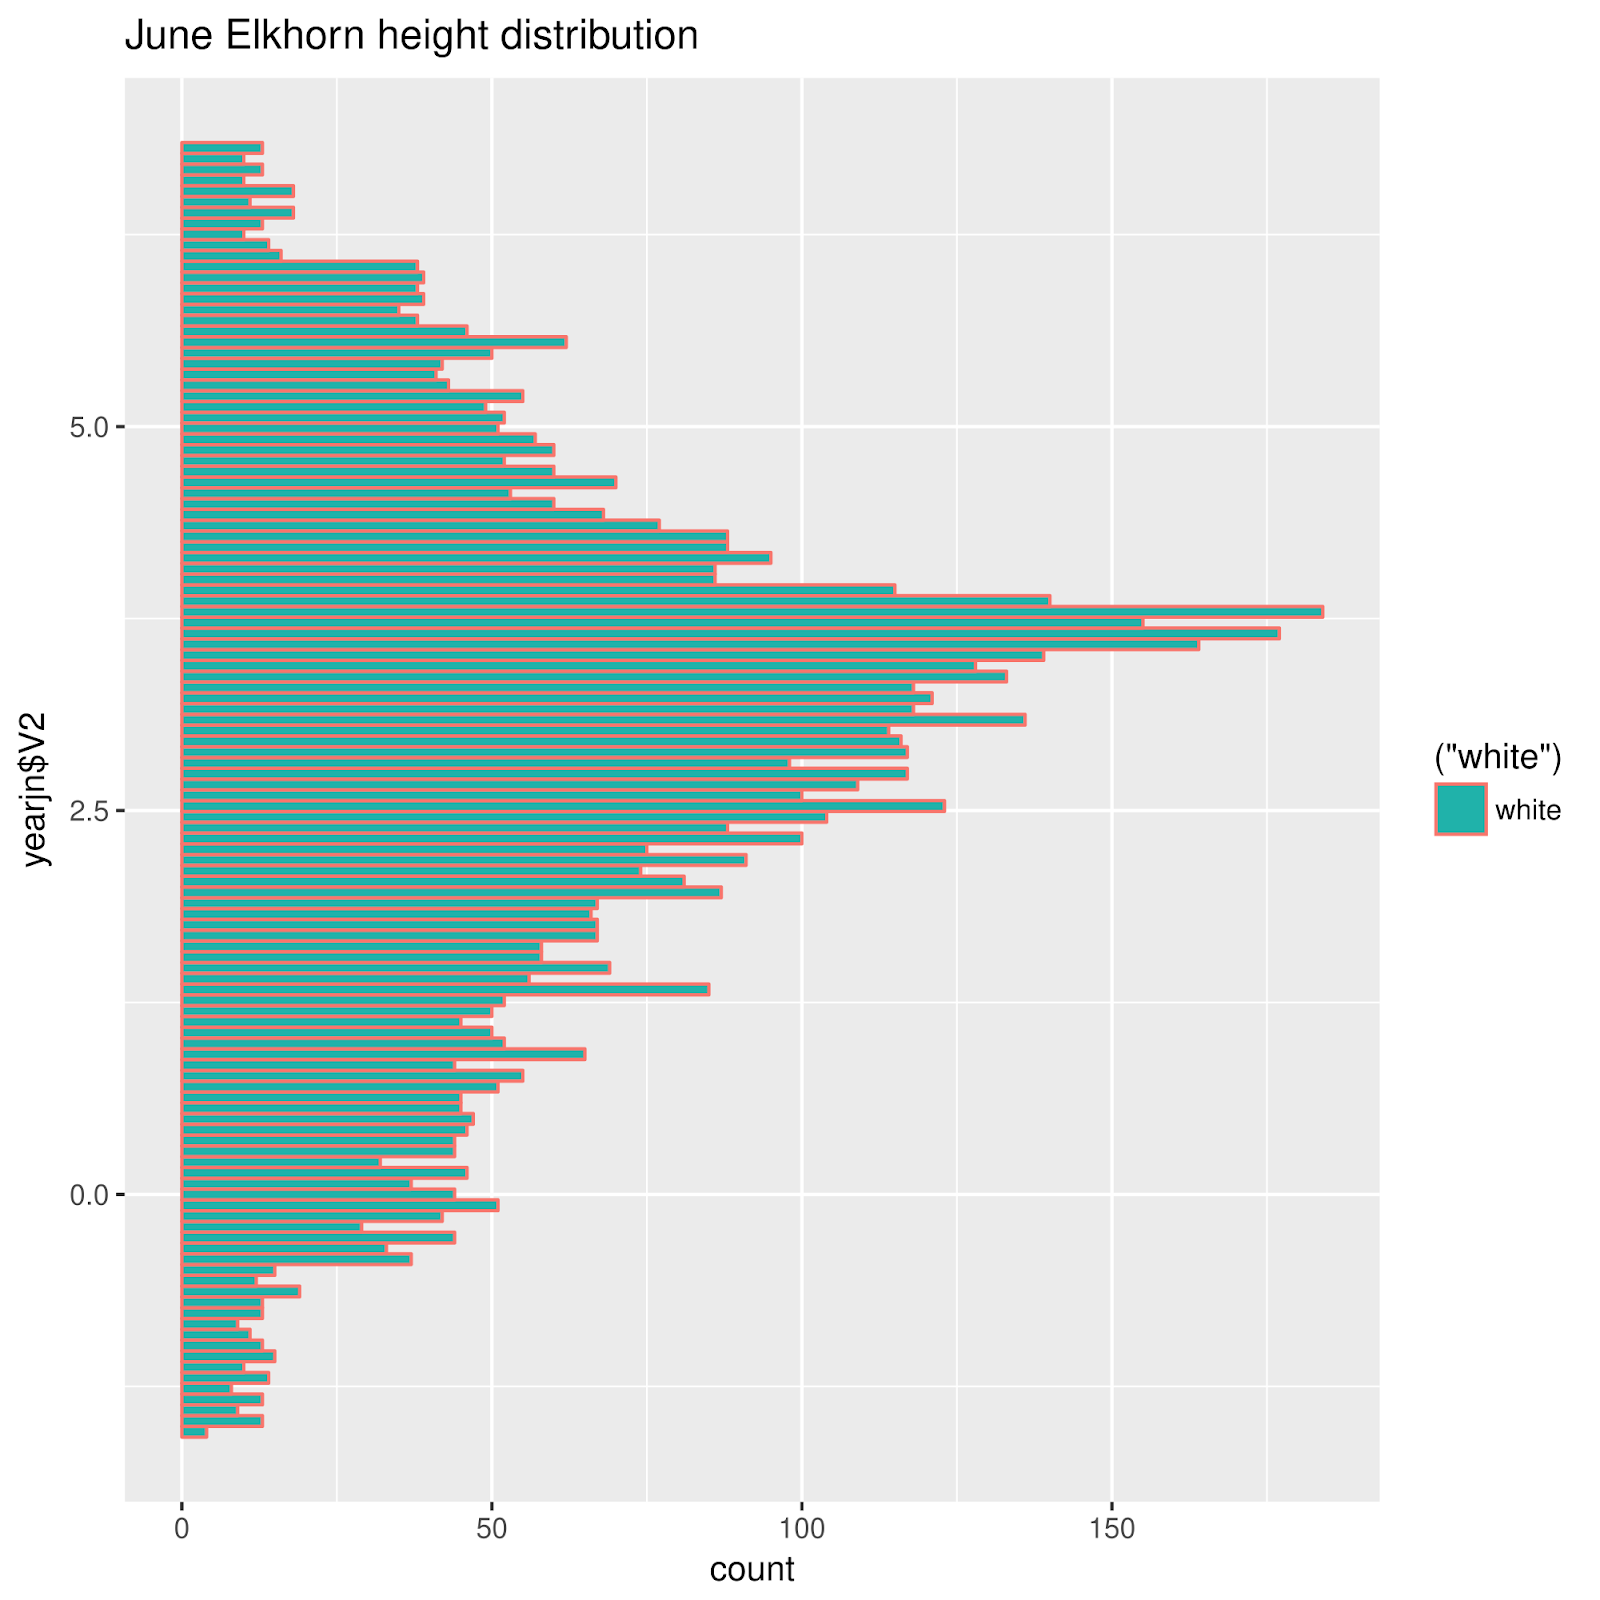
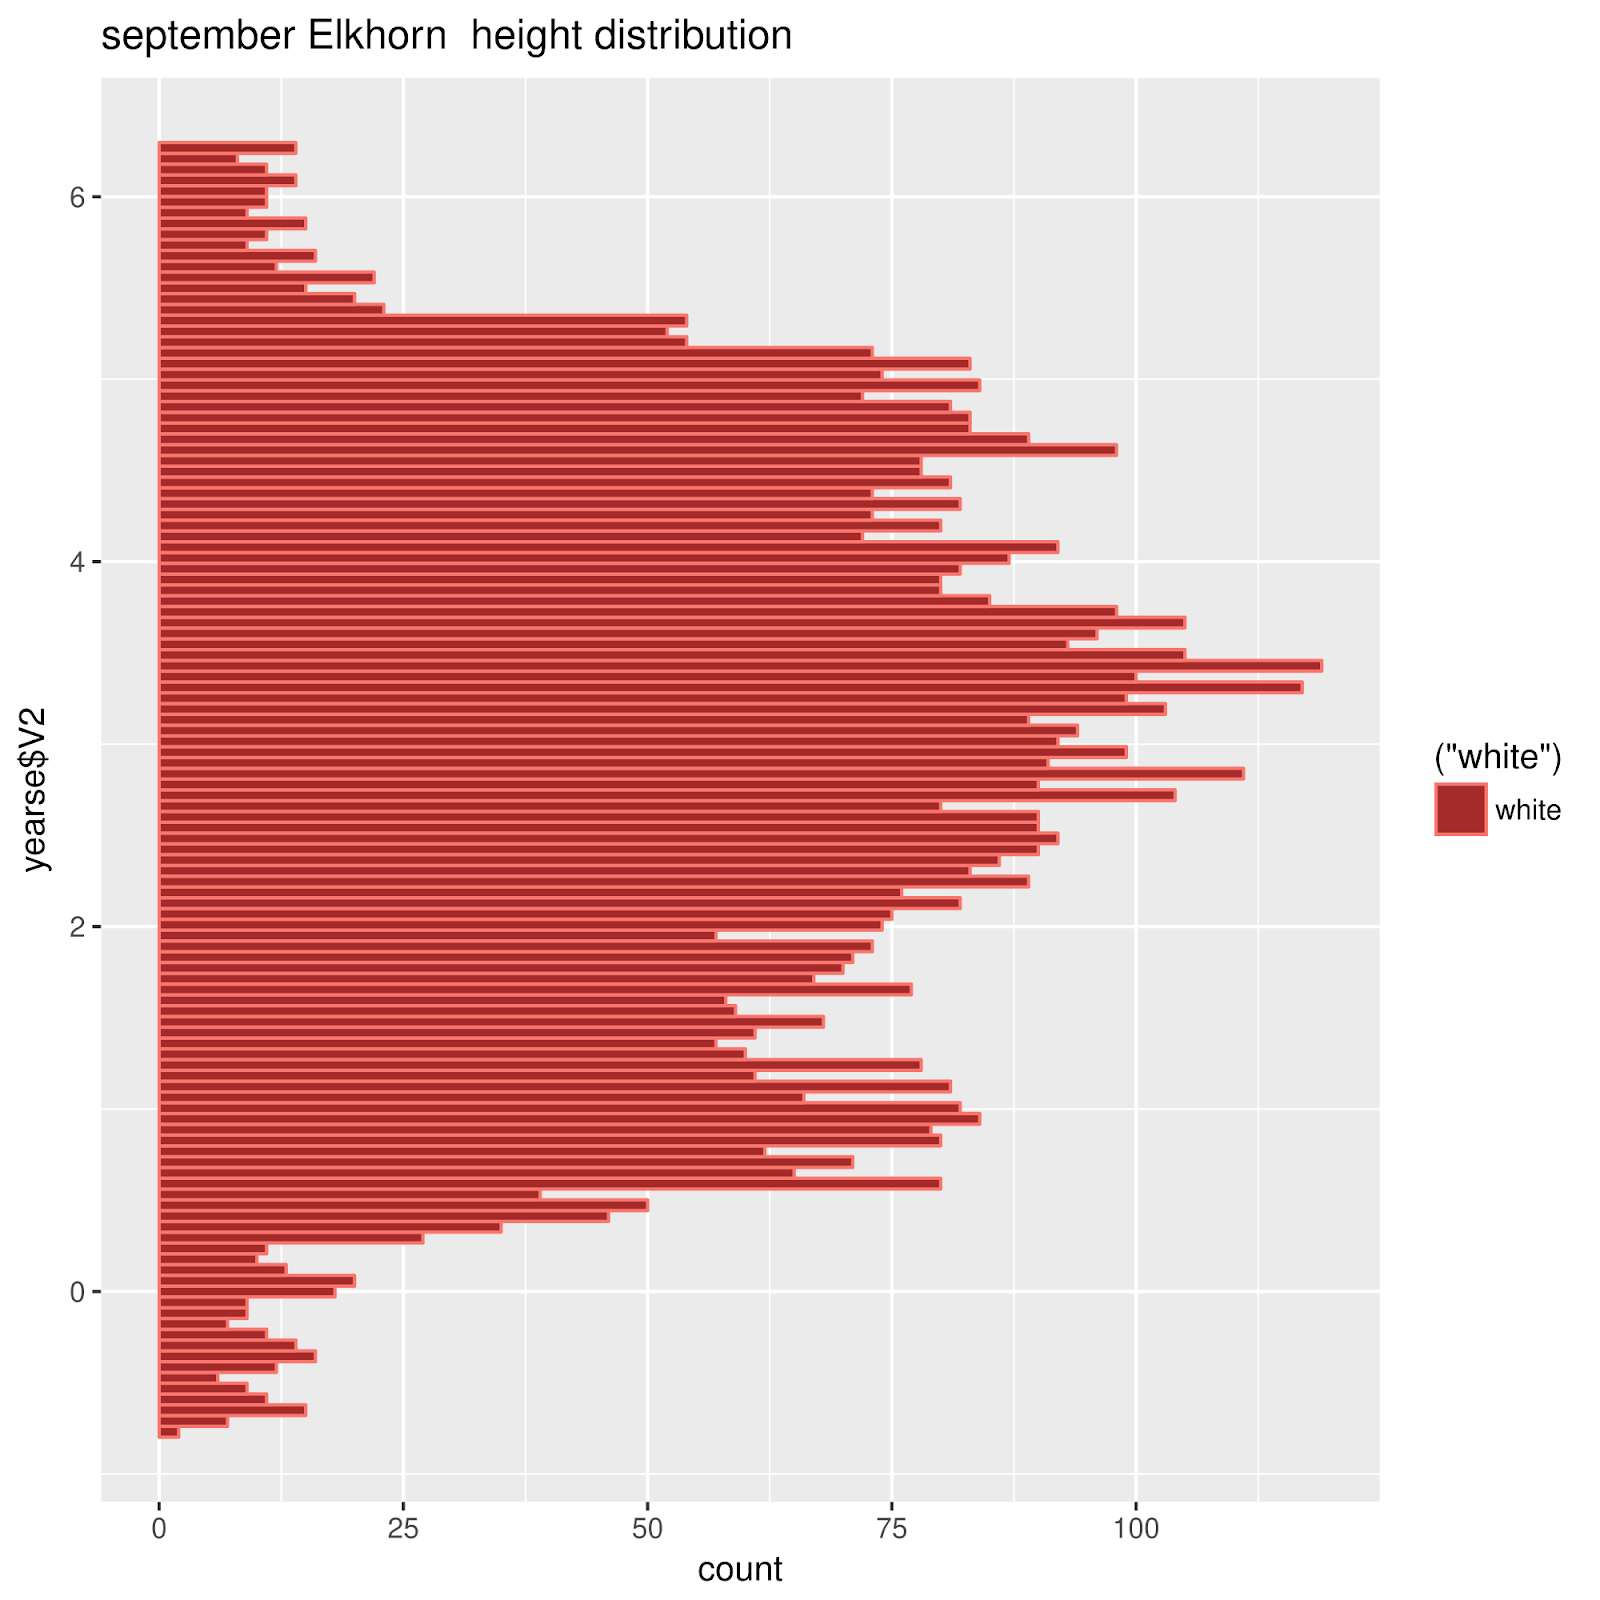
Elkhorn Slough December, March, June, and September
The differences between Elkhorn Slough and Chuuk Lagoon are notable.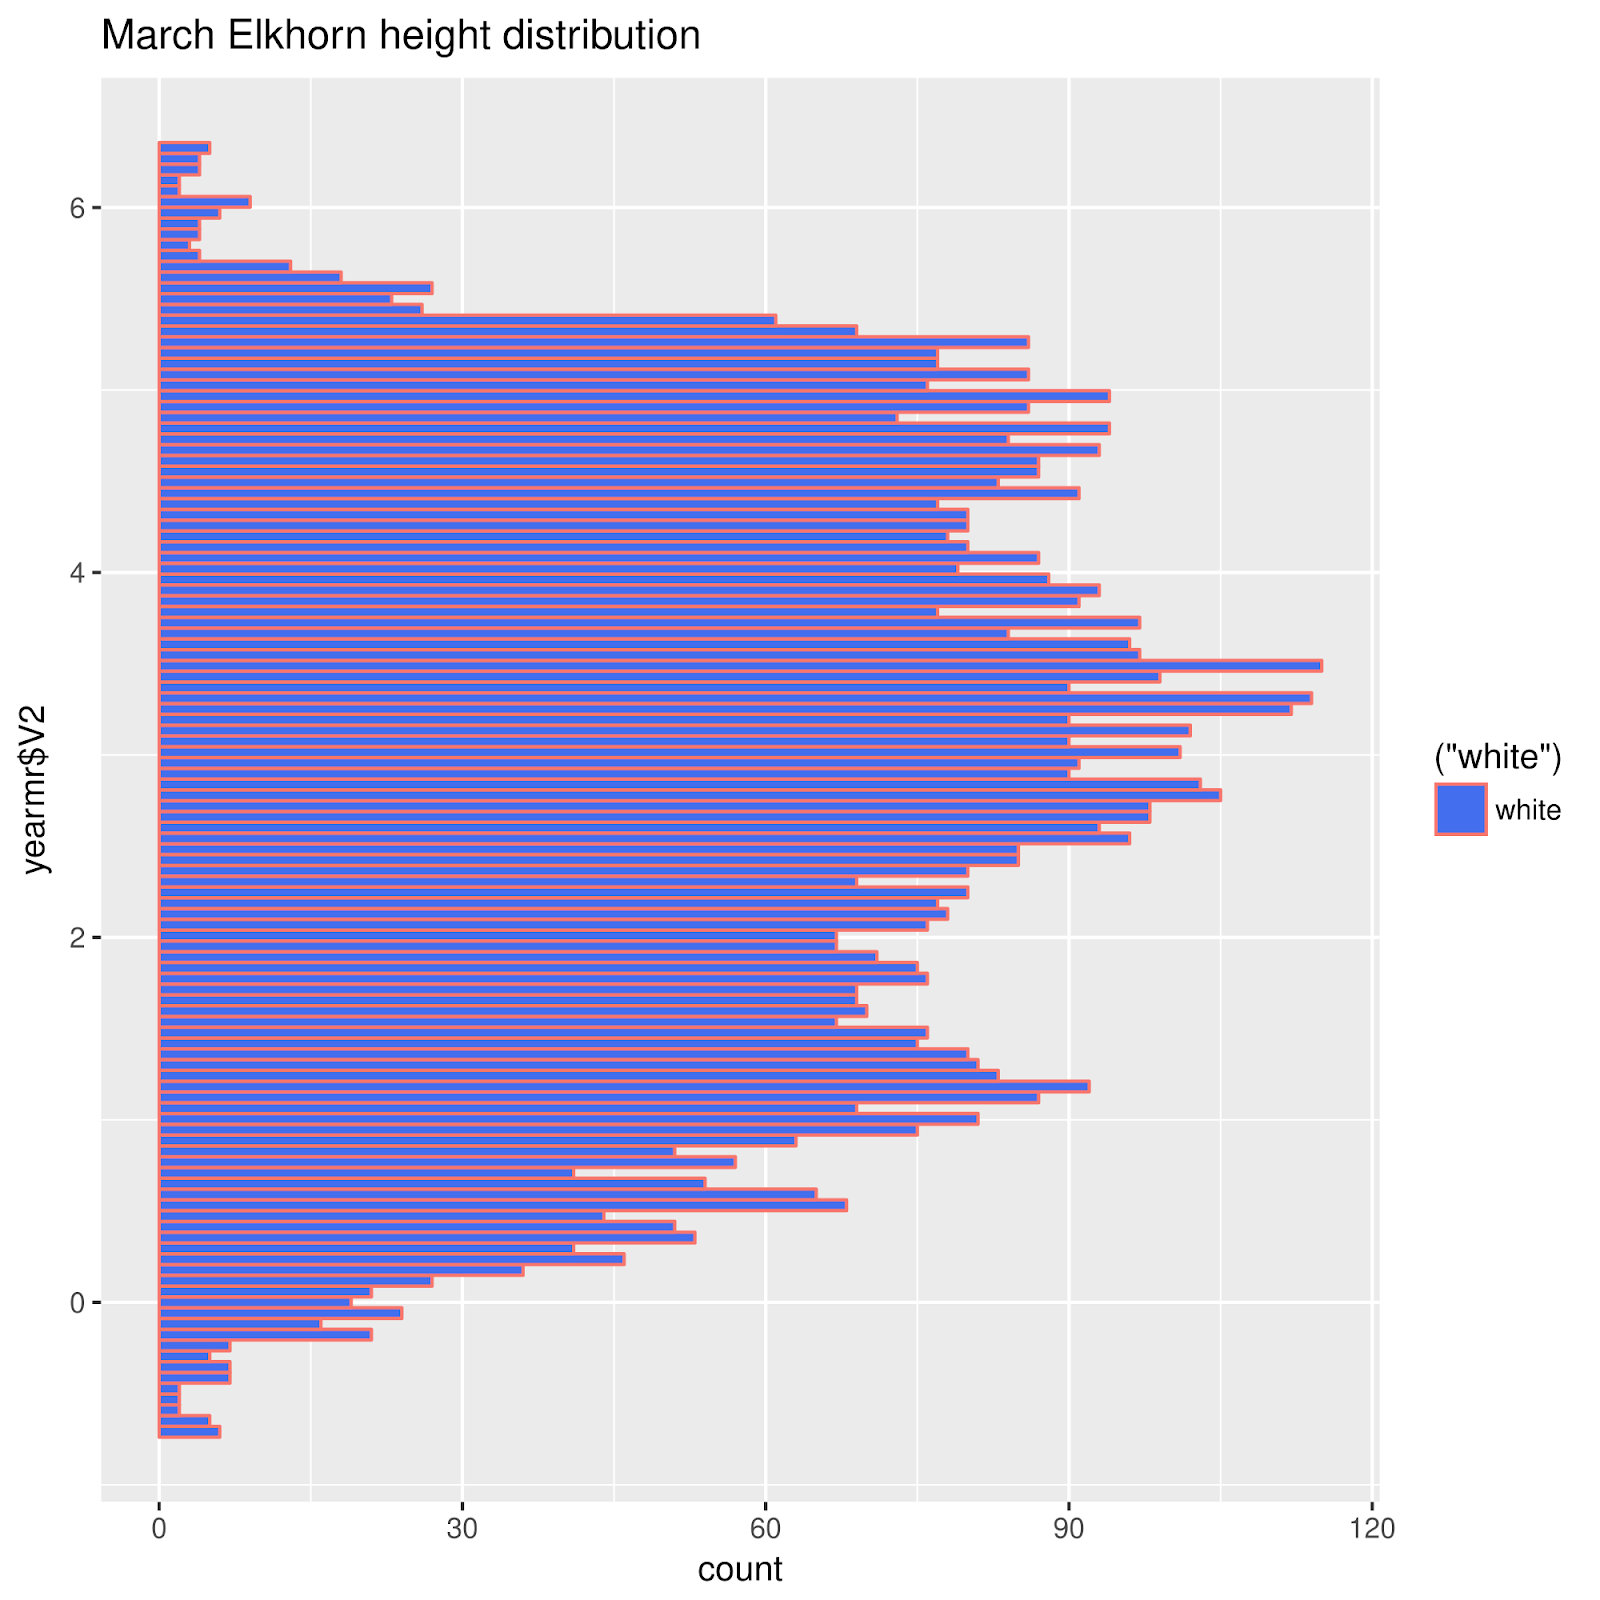 |
| March |
 |
| December |
 |
| June |
 |
| September |
Another distribution diagram: a continuous distribution curve.
This time, each month is traced in a different color. This is experimental; I did not keep a record of the colors for each month!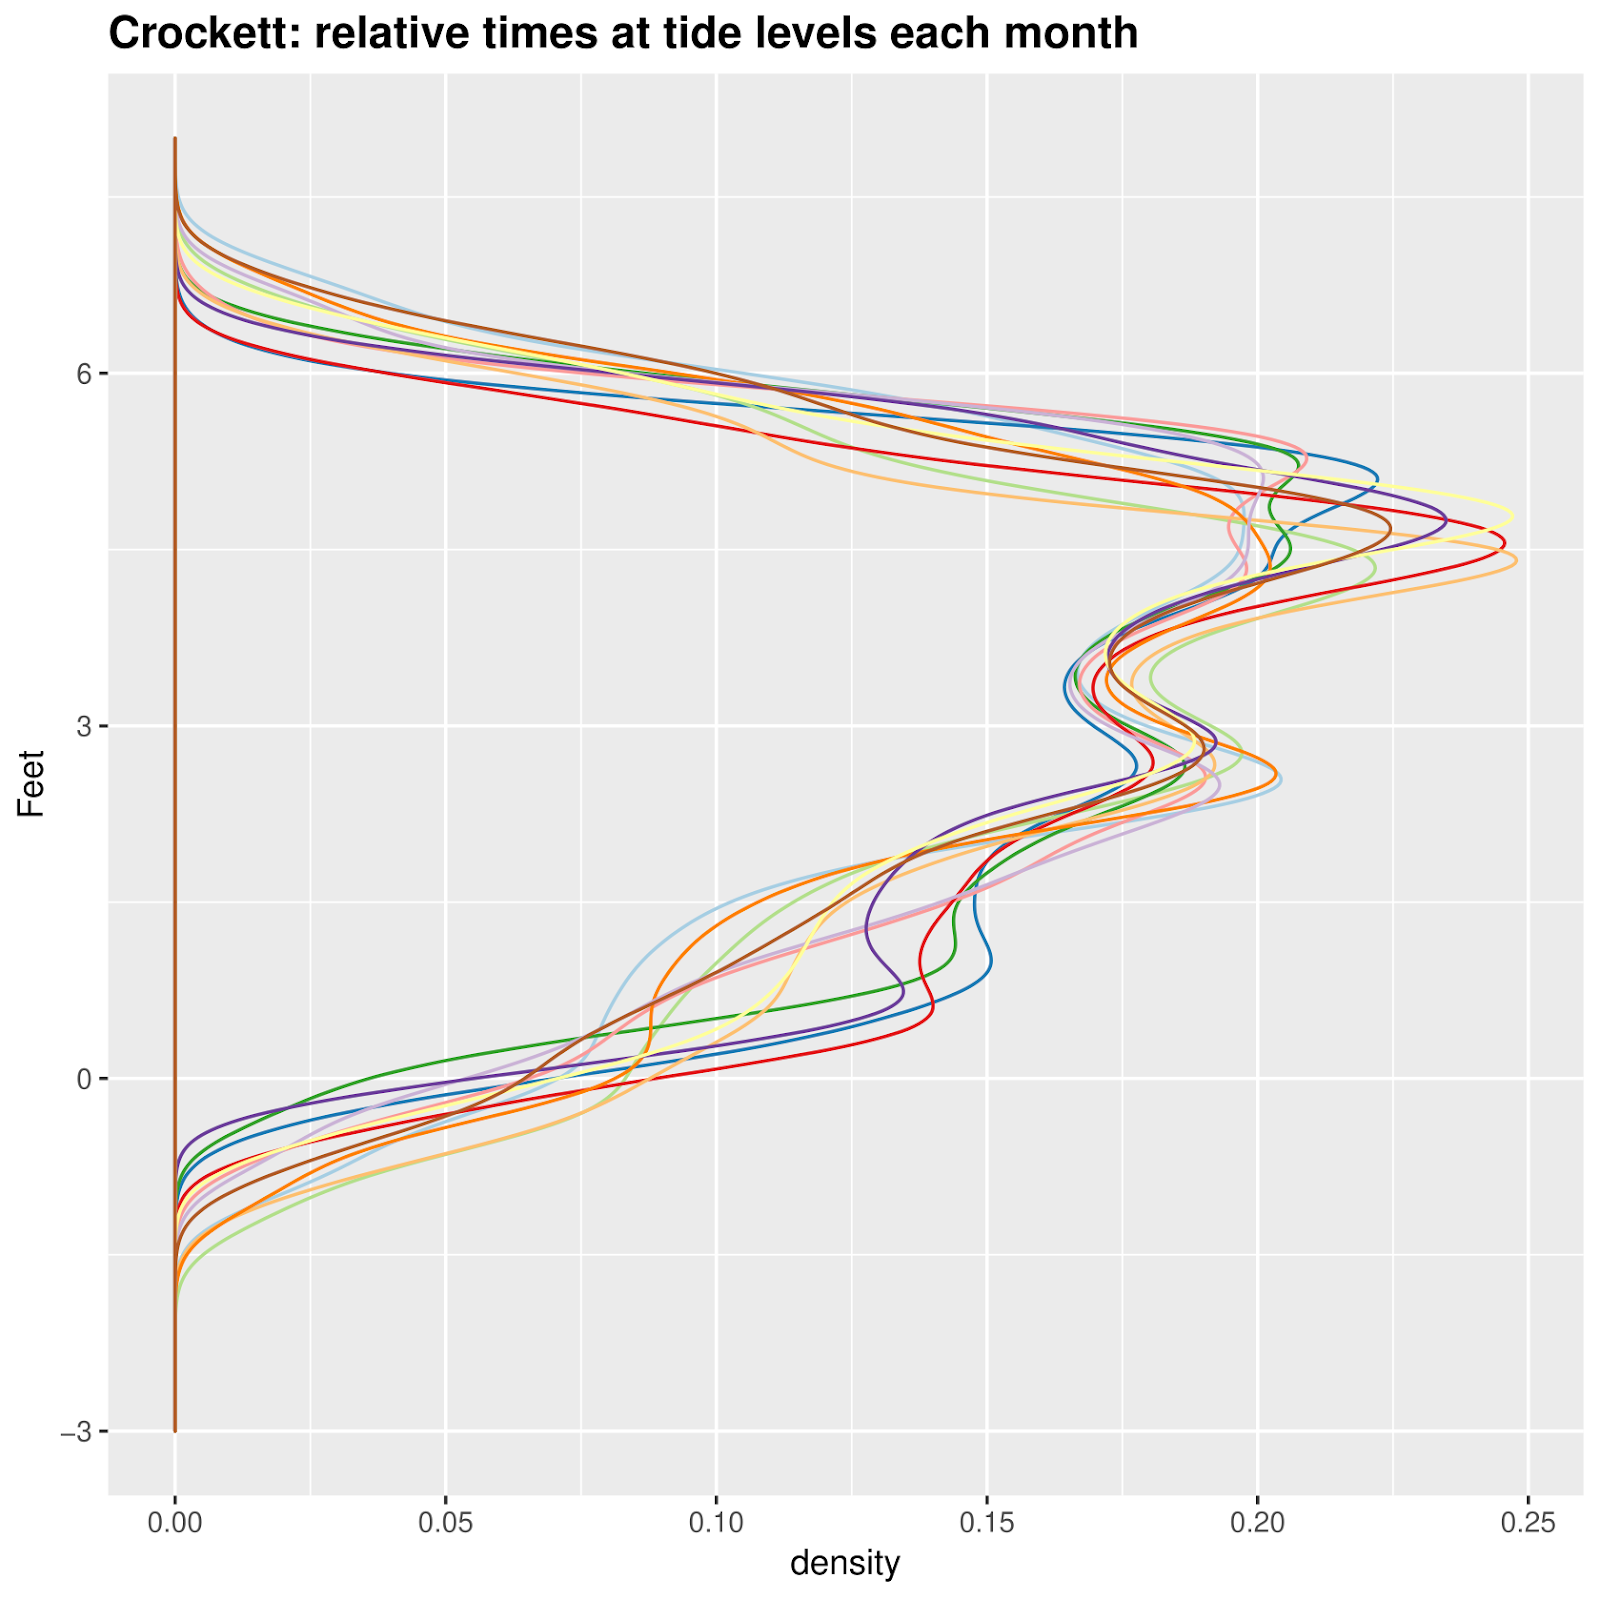
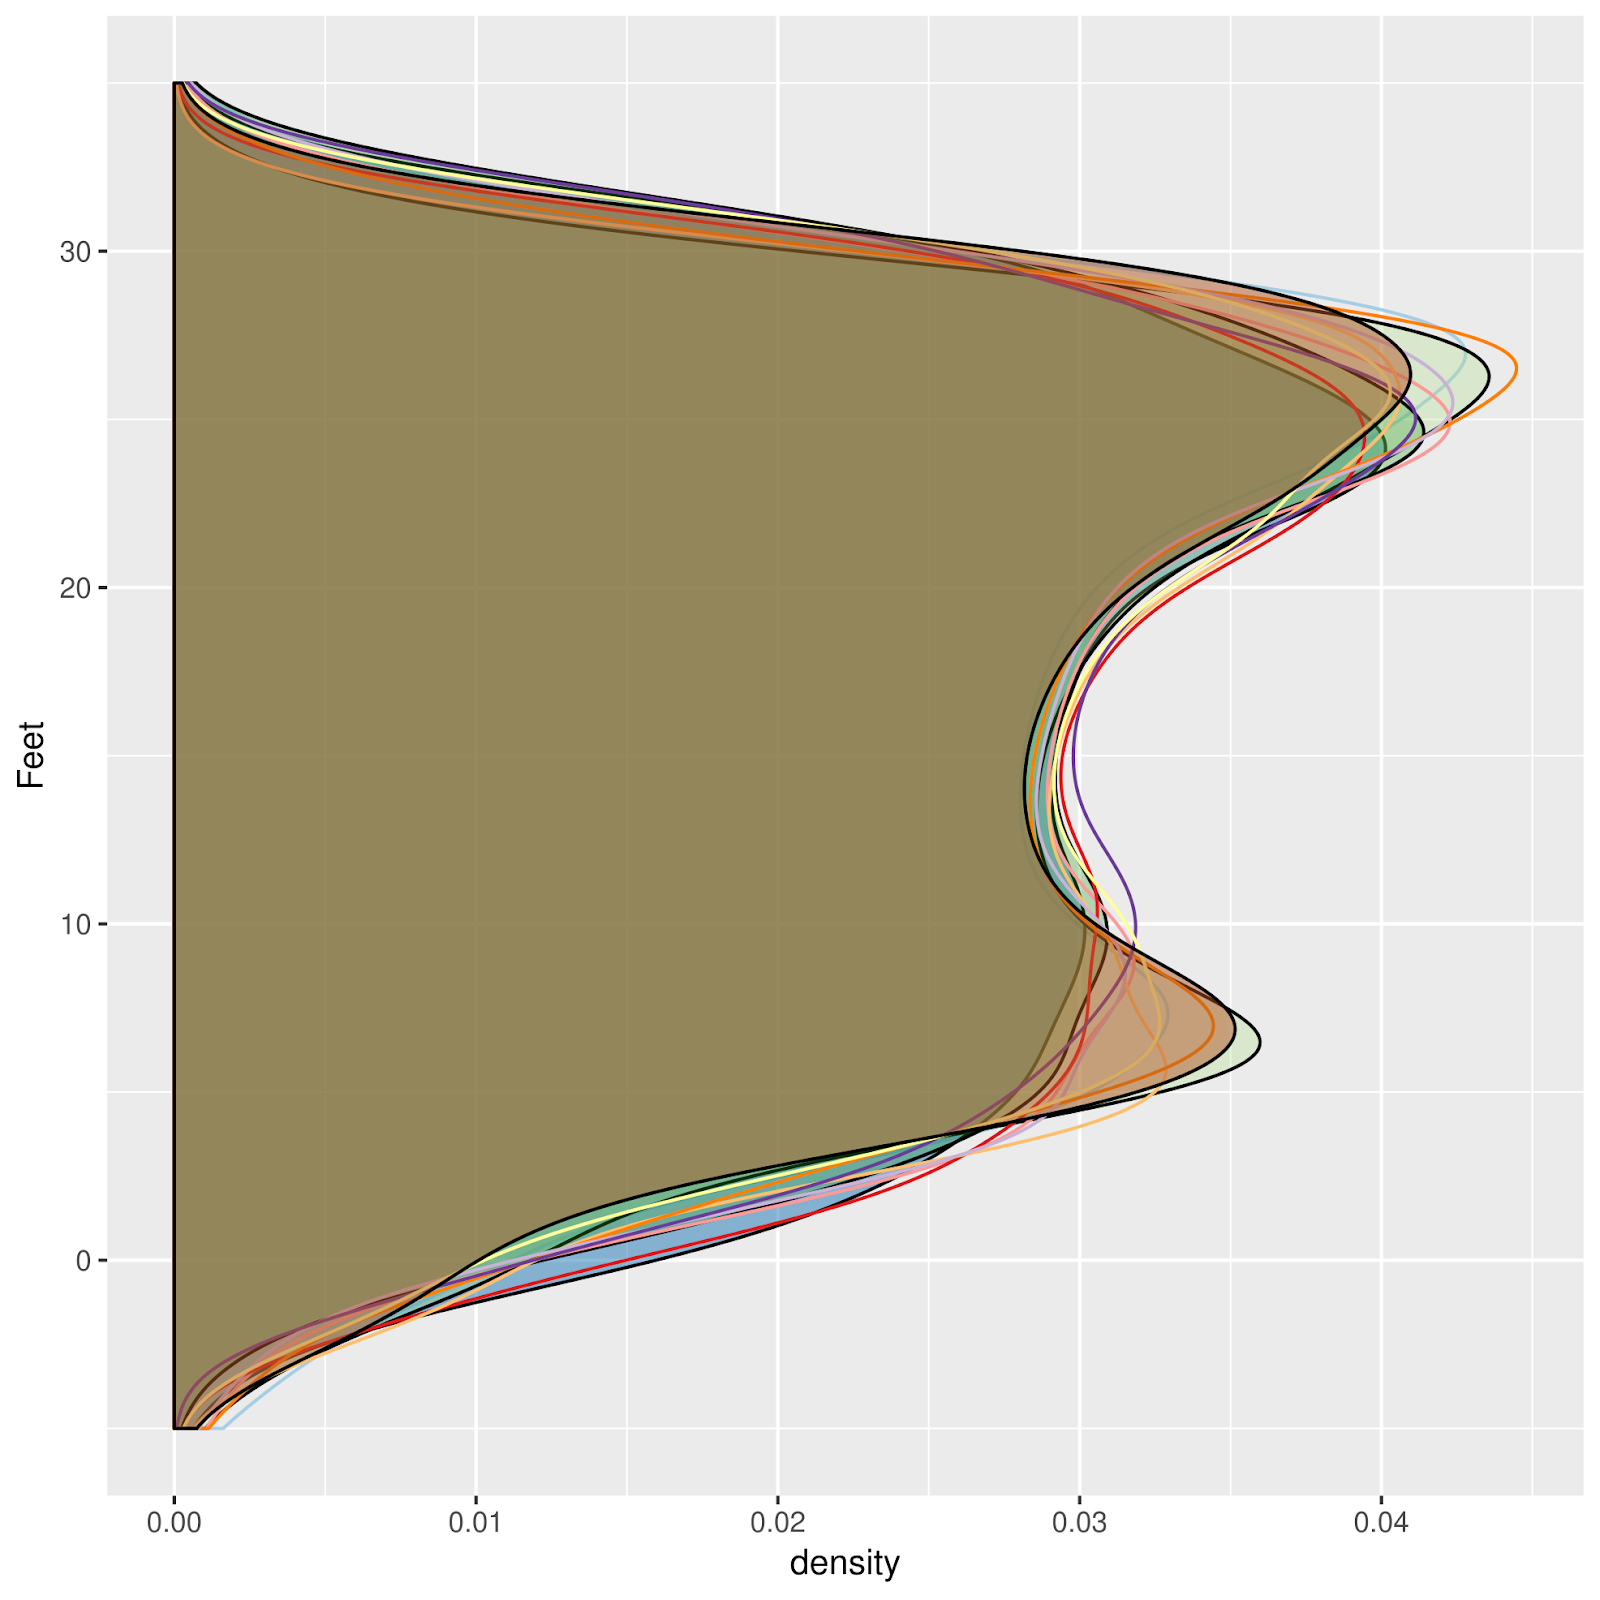
And another way to represent similar data, with transparent fill:
Saturday, August 10, 2019
Redwood City Tide Station

 |
| The business end. |

Saturday, August 3, 2019
A Beeswarm plot, for St. Petersburg, Florida
I'll try any kind of graph. Distribution frequency plots are described in Pugh's 1984 Sea Level Science. I saw a beeswarm plot, don't remember where; it seemed an interesting way to do a distribution frequency plot.
In a beeswarm plot, data is plotted along a single axis, in this case, tide water levels. No overlapping points are allowed; each overlapping point is "jittered" off to one side of the other point(s) at the
Are beeswarm plots informative? i tried. As usual I had to fiddle (speaking of which, a "violin plot" does something similar. Perhaps I'll try one). The "beeswarm" package for R makes production of these plots pretty easy. My first attempt suggested to me that a smaller amount of data might be more manageable. Eventually, something like this appeared, for St Petersburg, FL:
A first approximation: Predictions for June 17--28
Does the Moon figure into the distribution of water levels. I think this information is useful when considering intertidal zonation. The following is a beeswarm plot for hourly predictions for June, from New Moon to First
Quarter June 17--26). What, then, is this prominaent horizontal feature

Comparing with a plot for a couple of these days
Below, the same plot has been placed together with a plot of the tide at St Petersburg for two days in this period of time. The hold ups
seem to be encoded as the horizontal line

A Month at a Time
As a first approximation, I wondered whether it would be useful to divide time into quarter moons. The first reason: a useful number of points plotted on a single vertical beeswarm axis looks stupidly cluttered. Maybe it would be easier to plot short periods of time, like a month? No, a month was waaay to cluttered. A week looked alright.
A month at a time
So I used quarter moons. I have some misgivings about this choice. Next time I may CENTER the time division on a full moon, quarter moon, or new moon. Here, while it looks interesting, I'm pretty sure that much information about the actual full or new moon's influence.
I like it. It says something. The tides of St Petersburg exhibit some interesting quirks, reflected in these plots.
These are Beeswarm plots, a kind of univariate distribution plot, like histograms, and maybe a stem and leaf diagram of a kind. Each vertical plot represents a week (or so), hourly predictions for a quarter of the moon. Black, for example, represents the span between New Moon and First Quarter.

Maybe an inverted colorscheme would look better on the screen. The following was inverted in The Gimp, and exported as PNG, from a PDF.
Each vertical plot is a distribution plot, for one Quarter of a Lunar Cycle. The first one, in January, represents the period between NM and First Quarter (Q1), then Q1-> FM; FM -> Q3; Q3->NM, etc. 48 of these quarters are represented, from January into December of 2019.
These are predictions, from Xtide.
I don't know why almost everywhere I graph a tide, no matter how, something interesting pops up! What are we visualizing here?

Subscribe to:
Posts (Atom)
-
 Just one image among many on the Internet, of a tide machine, together with Arthur Doodson, who used such tide engines to profile the tides...
-
This video was linked on the Emacs Org-mode mailing list. The discussion was about an desire to incorporate timezones into some particular ...
-
 An alternative approach to visualization of tides has been provided by Ron Hipschman, of San Francisco's Exploratorium. A friend had as...
