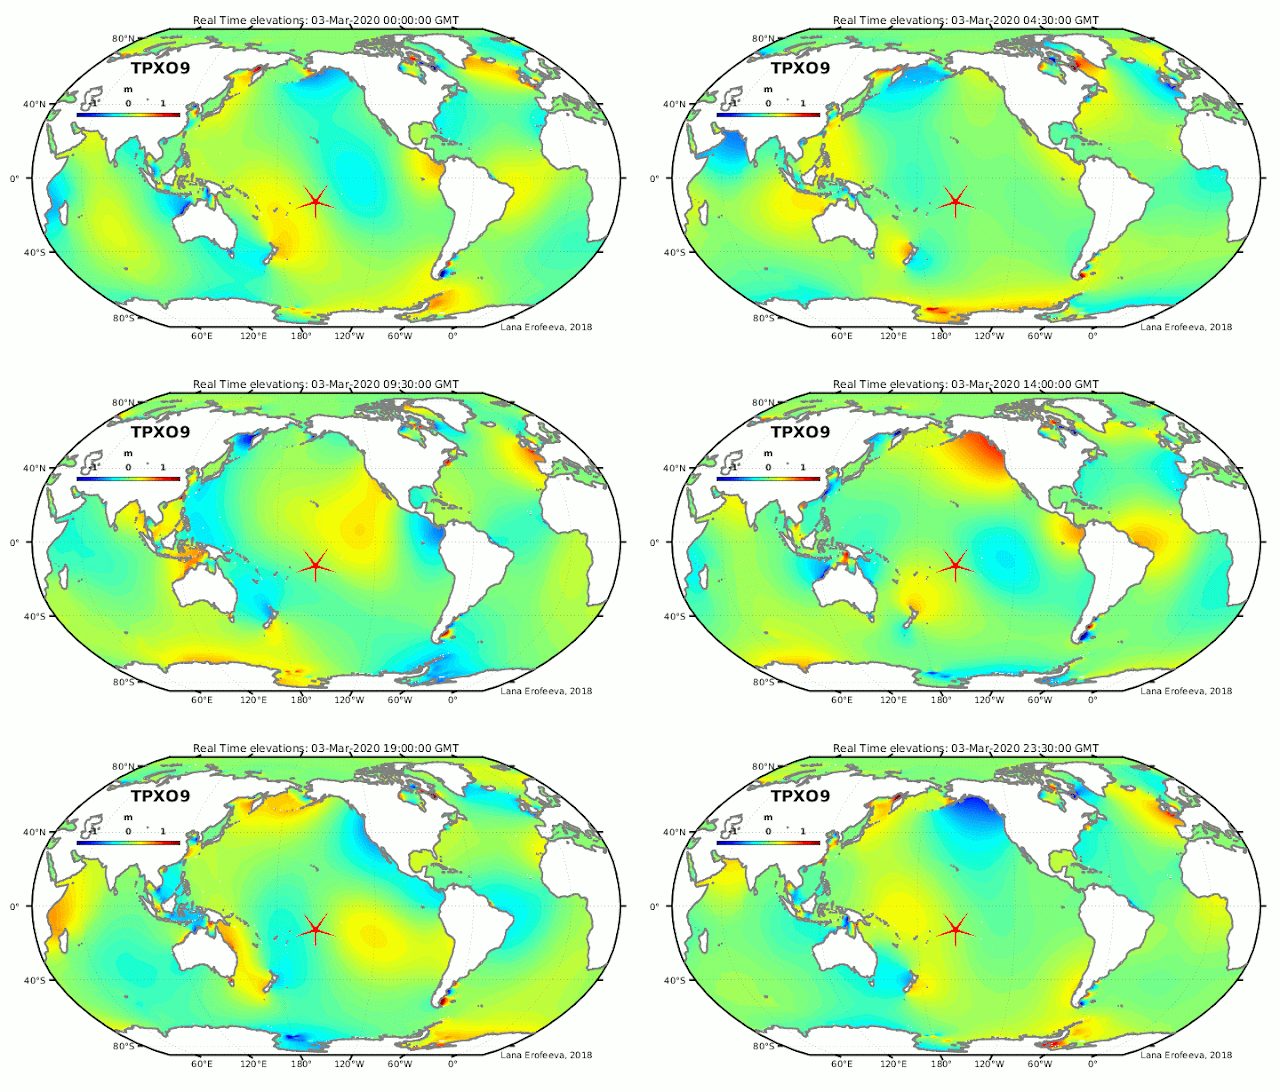
Tide science long suffered from a lack of measurements of tides in mid-oceans. Am impressive number of tide gauges have dotted the coasts. In the central Pacific, for example, tide records have been available only for isolated, scattered islands. In recent years, satellites have been able to measure sea level with an accuracy of a few centimeters at thousands of points all over the globe.
William Whewell led one of the first science projects: he organized volunteers all over the globe to measure the tide. In her blog, Caren Cooper
describes his "great tide experiment":
With the consent of the British Admiralty, Whewell coordinated thousands
of people in nine nations and colonies on both sides of the Atlantic in
the synchronized measurement of tides. At over 650 tidal stations,
volunteers followed Whewell’s instructions for measuring tides every 15
minutes, around the clock, during the same two week period in June 1835.
Volunteers in the “great tide experiment” included dockyard officials,
sailors, harbormasters, local tide table markers, coastal surveyors,
professional military men, and amateur observers.
Drawing on this data, Whewell compiled a tide map:
Whewell brought it all together into maps illustrating how the tides
progressed across the Atlantic Ocean and onto shores, inlets, ports, and
into rivers and estuaries.
With no measurements mid-Ocean, he had to fill in the gaps with guess work and deduction. Later, in 1909, Rollin Harris had more data available when he produced the following map in Popular Science Monthly of the tides of the Atlantic. The lines represent the progress of the tide over time, each line representing one hour. Roman numerals represent the hours.
Until quite recently, knowledge of the tides of the central Pacific Ocean were limited to records of tide gauges on islands. Whewell deduced certain features from known features of the tides around the coasts of the Ocean. The following shows a global map, somewhat more recent.
The following figure is a much more modern iteration of such a map based on satellite altimetry, from NASA.
A particularly effective illustration of Amphidromes is found on the University of Pennsylvania website.
The tides of Tahiti are famed for their minimal amplitude range, and have drawn the attention of a number of tide scientists in the 19th and Early 20th Centuries, due to this and other peculiar characteristics. Captain James Cook remarked, in Tahiti, that "The tides are perhaps as inconsiderable in these Seas as in any part of the world." In attempting to explain seeming anomalous times of high and low tides in Cook's measurements, Henry Maskelyn, a Royal Astronomer, suggested that measuring the tides at certain times was problematical:
The times of high and low water seem to be subject to great irregularity on particular days; no doubt owing to the small rise of the water ... which renders it more liable to be disturbed by the action of the winds and other causes: part of the irregularity may be attributed to the difficulty of observing the time of flood or ebb, with any degree of certainty.
The following two animations are
models of global tides for two days, the first near the time of 1st Quarter Moon of early March, 2020, during a period of
Neap Tides. The second represents a period of
Spring Tides, when the moon is Full in April 2020, during Spring Tides. I have taken the liberty of modifying Svetlana Erofeeva's animation by position a red star near the position of Tahiti, to illustrate the relationship between the "inconsiderable" tides of Tahiti and the nearness to the
Amphidrome.
Neap Tide
Spring Tide
 |
| Spring Tide. A red star is placed near Tahiti. |
|
This animation shows water sloshing around the oceans, under the
influence of the Moon and Sun. Because of the shape, size, and depth of
the Pacific Basin, the movement at Tahiti, near the Star, is indeed
inconsiderable. T hese animated models amount to Space Age tide tables. Availability of satellite sea level data has made it possible to predict tides even in mid-Ocean, where, for Centuries, no tide data, or very little, could possibly exist.
These two animations are modified versions of the TPXO9 model products
of Oregon State University. These animations By Svetlana Erofeeva and
Gary Egbert cannot be overestimated in their contribution to modern tide
science. My general understanding of the workings of the tides has
benefited immensely from their study. Their work is at the forefront of
the long history of the science of tides.


